No readings held for this station
This station has not reported a qualifying observation since Thu 1 Jan 1970. A separate archive of daily values from 1957 is linked under data sources.
15 Octobers on record
Average high · NOAA GHCN-DailyAcross 15 Octobers, 1957 to 2013, this station's October average is level. A fit through its own record, not a climate finding.
Warmest October here: 2007, averaging 41.3°C. Coldest: 1999, averaging 38.5°C.
The record book, month by month
Highest and lowest ever recorded here · with the day it happened- 1
Between its coldest night and its hottest day, this place has swung 50.2°C.
From our dataRecord high 51.5°C against record low 1.3°C.
New facts every day. Report an error.
- Date
- Friday, 29 June 1990
- Time of day
- Not recorded. The daily archive stores the day, not the hour.
- Location
- Khartoum, Sudan
- Position
- 15.60°N 32.55°E · 380 m
The highest in available records since 1957. Source: GHCN-Daily, 1957 to 2019.
- Date
- Friday, 10 January 1992
- Time of day
- Not recorded. The daily archive stores the day, not the hour.
- Location
- Khartoum, Sudan
- Position
- 15.60°N 32.55°E · 380 m
The lowest in available records since 1957. Source: GHCN-Daily, 1957 to 2019.
Khartoum (WMO 62721) is a weather station in Sudan, 380 m above sea level.
Nearby, and the opposite
- Nearest stationGondar18.4°C627.1 km away, today's high
- Warmest nearbyAbu Simbel Arpt35.0°C756.5 km away
- Coldest nearbyBahar Dar19.0°C686.4 km away, today's low
- The opposite of hereVostok−62.3°CAntarctica
The nearest other station is 627.1 km away. Quality control compares a reading against stations within 150 km, so there is nothing close enough to cross-check this one against.
Where this station is
This station lies about 1,700 km north of the equator. It lies within the tropics.
Where Khartoum is






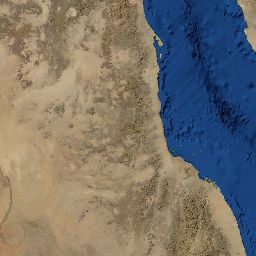

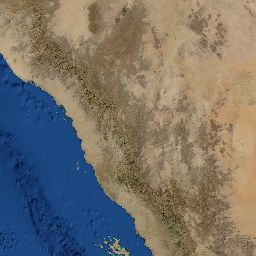









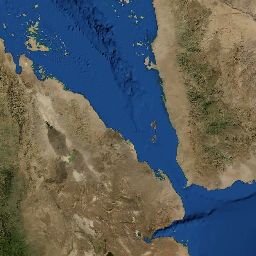







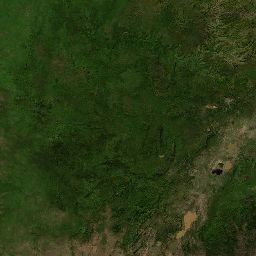

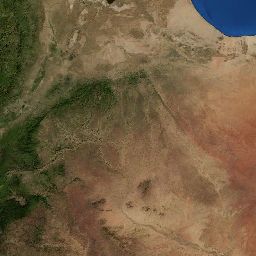

Land surface temperature for 2026-10-05, from NASA GIBS. This is the temperature of the ground seen from orbit, not the air, and it is never ranked against air readings. Cloud hides the ground, so gaps are unread rather than guessed.
View more on Google Maps15.6000°N, 32.5500°E
Khartoum, answered from the data
How hot does it get in Khartoum?
The warmest month on record here is June, when the highest reading has reached 51.5°C (124.7°F) on Friday, 29 June 1990.
NOAA GHCN-Daily, highest reading recorded in each month
How cold does it get in Khartoum?
The coldest month on record here is January, when the lowest reading has fallen to 1.3°C (34.3°F) on Friday, 10 January 1992.
NOAA GHCN-Daily, lowest reading recorded in each month
What is the highest temperature ever recorded in Khartoum?
51.5°C (124.7°F) on Friday, 29 June 1990. That is the highest in the daily record we hold for this station, which runs since 1957. It is not an officially certified record unless a meteorological authority has recognised it.
NOAA GHCN-Daily
What is the lowest temperature ever recorded in Khartoum?
1.3°C (34.3°F) on Friday, 10 January 1992. That is the lowest in the daily record we hold, which runs since 1957.
NOAA GHCN-Daily
Data sources for this page
Readings here arrive through NOAA METAR. METAR is the routine aerodrome weather report, issued for aviation, typically every 30 or 60 minutes and more often when conditions change. It updates far more frequently than a synoptic report, which is why these pages have a usable chart.
| Figure | Source | Type |
|---|---|---|
| Latest reading, today so far | NOAA Aviation Weather Center (METAR) and NOAA NWS WMO bulletins (SYNOP) | Measured, station |
| All-time, monthly and on-this-day records | NOAA NCEI Global Historical Climatology Network daily (GHCN-Daily), 1957 to 2019 at this site and its predecessors | Measured, station |
| Nearby stations and distances | Computed from station positions in our own database | Calculated |
How these readings are checked
Every reading on this page has passed the checks below. A reading that fails any of them is stored as refused and can never be ranked, shown as a record, or counted in a daily high or low.
No reading from this station has been refused in the 11 days since readings began being logged against individual stations.
- 01
Has a real position
A reading with no usable latitude and longitude is discarded. It cannot be ranked, mapped, or compared with its neighbours, and a temperature with no place is not an answer to which place is hottest.
- 02
Position is not a placeholder
Some feeds fill an unknown position with a stand-in value such as 99.99 degrees or an elevation of 9999 m. Those are not coordinates. They are caught separately from a missing position because a station placed at a fake point has no neighbours, so the neighbour check below can never see anything wrong with it.
- 03
The bulletin itself is current
SYNOP arrives as files that are only re-read when they change. A file that has stopped being updated is set aside whole, before any reading inside it is considered.
- 04
The reading is recent enough for its network
Different networks get different windows, because they report at different rates: 2 hours for METAR, which transmits continuously, and 9 hours for SYNOP, which reports at 00, 06, 12 and 18 UTC. A single rule would have discarded the entire synoptic network, including every station in Antarctica.
- 05
Inside the range of measured temperature